CDO Charts
These charts show characteristics of a sample set of 793 asset-backed-securities CDOs that originated between October 1998 and February 2009. The sample is drawn from the population of active deals in Moody’s CDO Enhanced Monitoring Service database.
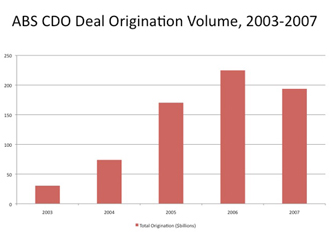
ABS CDO Deal Origination Volume, 2003-2007
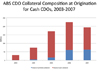
ABS CDO Collateral Composition at Origination for Cash CDOs, 2003-2007
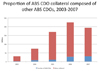
Proportion of ABS CDO collateral composed of other ABS CDOs, 2003-2007
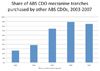
Share of ABS CDO mezzanine tranches purchased by other ABS CDOs, 2003-2007