The Story of a Mortgage Security: Inside CMLTI 2006-NC2
Before the Crisis
National September 2006- Avg Initial Loan Balance $210,580
- Avg FICO Score 620
- Avg Debt-to-Income Ratio 40.6
- Avg Initial Interest Rate 8.64%
- Most Frequent Product 2/28 ARM with 40 year amortization
Homes Lost category includes liquidated and bank “real estate owned” properties. Source: FCIC research
Of 181 loans, 88 homes lost and 24 still active by 2010
September 2010 Status of Arizona Loans in CMLTI 2006-NC2
-
Delinquent

-
Homes Lost

-
Current

-
Paid

Before the Crisis
Arizona September 2006- Avg Initial Loan Balance $189,072
- Avg FICO Score 609
- Avg Debt-to-Income Ratio 40.4
- Avg Initial Interest Rate 8.64%
- Most Frequent Product 2/28 ARM with 40 year amortization
Homes Lost category includes liquidated and bank “real estate owned” properties. Source: FCIC research
Of 912 loans, 494 homes lost and 119 still active by 2010
September 2010 Status of California Loans in CMLTI 2006-NC2
-
Delinquent
-
Homes Lost
-
Current
-
Paid
Before the Crisis
California September 2006- Avg Initial Loan Balance $321,655
- Avg FICO Score 637
- Avg Debt-to-Income Ratio 41.8
- Avg Initial Interest Rate 8.6%
- Most Frequent Product 2/28 ARM with 40 year amortization
Homes Lost category includes liquidated and bank “real estate owned” properties. Source: FCIC research
Of 556 loans, 197 homes lost and 73 still active by 2010
September 2010 Status of Florida Loans in CMLTI 2006-NC2
-
Delinquent
-
Homes Lost
-
Current
-
Paid
Before the Crisis
Florida September 2006- Avg Initial Loan Balance $194,551
- Avg FICO Score 612
- Avg Debt-to-Income Ratio 41.0
- Avg Initial Interest Rate 8.9%
- Most Frequent Product 2/28 ARM with 40 year amortization
Homes Lost category includes liquidated and bank “real estate owned” properties. Source: FCIC research
Of 113 Loans, 76 Homes Lost & 10 Still Active by 2010
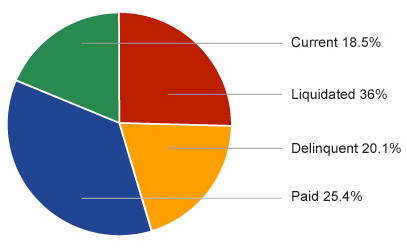
September 2010 Status of Nevada Loans in CMLTI 2006-NC2
-
Delinquent
-
Homes Lost
-
Current
-
Paid
Before the Crisis
Nevada September 2006- Avg Initial Loan Balance $221,584
- Avg FICO Score 635
- Avg Debt-to-Income Ratio 41.3
- Avg Initial Interest Rate 8.7%
- Most Frequent Product 2/28 ARM with 40 year amortization
Homes Lost category includes liquidated and bank “real estate owned” properties. Source: FCIC research
The 32 megabyte Excel data file contains the raw data from these 4,499 loans, including the information about the loans and the borrowers. The performance of all of the loans is also included. Primary data provided by BlackBox Logic Inc.; broker compensation data provided by IP Recovery Inc. Certain fields were altered to preserve the privacy of individual borrowers.
On June 9, 2006, Citigroup agreed to purchase approximately $1 billion in loans from New Century. The characteristics of the loans to be purchased were spelled out at that time, as was the price: Citi would pay $102.55 for every $100 in mortgage balance. The trade ticket and “stip” (stipulation) sheet summarize the details of the deal and the pool that would be created.
The deal would involve two pools of loans – one that conformed to the GSE limits and one that did not. On July 20, New Century sent Citi a description of the loans in the first pool. A week later they sent a description of the two pools combined.
Through late July and August, one or two at a time, loans were pulled from the pool for legal issues, because they had been sold into other pools, or for other reasons.
Due diligence for this deal was performed by 406 Partners, LLC. The review was to take place at New Century between 7/31 and 8/11. 406 Partners sent New Century the list of loans they wanted to review – as per the initial sale agreement, 25% of the loans would be sampled for credit review. In the end, more than 200 loans were removed from the pool.
As the loan purchase was closing on August 29th, New Century sent a final list of the 4,521 loans they were selling. Citi personnel saw violations of the initial agreement: 14 NINA loans (no income, no assets) and too few loans with prepayment penalties. They forced New Century to keep the 14 NINA loans and bargained the price down to account for the other problems.
With the loans settled, $978.6 million had to be moved from Citigroup to New Century. These loans were funded by a series of warehouse lines with individual loans serving as the collateral. New Century sent Citi the wire instructions; Citi sent the money, and the individual lenders released the loans as they were paid back.
Citi then began to market the various tranches of this mortgage-backed security
To sell the bonds, Citi needed the rating agencies to rate them. On September 11, S&P ran its model and confirmed the ratings of the individual tranches. When the deal was priced on September 12, the interest rates on some of the bonds were slightly different than those S&P had originally modeled. The final models were run on September 26 as the deal was closing. S&P sent the final ratings letter to Citi. For rating this deal, S&P earned $135,000. (A second agency, Moody’s, earned $208,000.)
When the deal closed on September 26 , Citi had lined up investors around the world. Banks and funds in England, Germany, Italy, France, and China all bought pieces of the deal.
Some investors merit special mention:
- Fannie Mae bought the A1 tranche
- Cheyne Finance, one of the first SIVs to collapse, bought the M1 tranche
- Parvest Euribor, one of the hedge funds owned by Paribas that froze redemptions, bought the M2 tranche
- Bear Stearns Asset Management and JP Morgan Chase’s securities lending group were also investors
Most of the mezzanine tranches were bought by CDOs, including the cash deal Kleros Real Estate III
In addition to cash deals, a number of synthetic/hybrid CDOs held credit default swaps (CDS) referencing the lower-rated tranches of this deal. These included Volans Funding 2007-1, Glacier Funding CDO V, and Auriga CDO
- Marketing documents for some of the synthetic CDOs that referenced the deal
- Auriga Pitchbook
- Auriga Offering Circular
- Auriga Term Sheet
- Volans 2007-1 Pitch Book
- Volans-2007-1 Term Sheet
- Volans 2007-1 CDO Offering Circular
- Glacier Funding V Term Sheet
- Glacier Funding V Pitchbook
Wells Fargo was chosen as the servicer of the loans and U.S. Bank as the trustee. As servicer, Wells processes payments from the borrowers and makes any necessary payments to the investors. Their responsibilities also include dealing with borrowers who miss payments and possibly foreclosing on those borrowers who are seriously delinquent.
The bonds would perform as long as the mortgages did.
The performance of CMLTI 2006-NC2 can be traced in parallel with a timeline of the crisis:
- July 10, 2007: Moody’s downgraded 399 residential mortgage-backed securities—the lower three tranches of this deal were among these downgrades
- August 9, 2007: BNP Paribas froze redemptions
- August 28, 2007: Cheyne Finance announced funding trouble
- October 11, 2007: More mass downgrades issued, including tranches of this deal
By 2008, foreclosures were rampant among these loans and loan modifications had begun. The lower-rated tranches were all wiped out. The A1 and some of the A2s were still performing. By late 2009, all the tranches had been downgraded.
By September 2010, many borrowers whose loans were included in this securitization had moved or refinanced their mortgages; by that point, 1,917 had entered foreclosure (mostly in Florida and California), and 729 had started loan modifications. Of the 1,715 loans still active loans, 579 were seriously past due in their payments or currently in foreclosure.
About This Data
The 32 megabyte Excel data file contains the raw data from these 4,499 loans, including the information about the loans and the borrowers. The performance of all of the loans is also included. Primary data provided by BlackBox Logic Inc.; broker compensation data provided by IP Recovery Inc. Certain fields were altered to preserve the privacy of individual borrowers.